- Views: 697
- Replies: 9
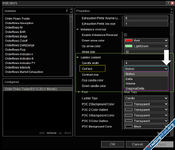
Orderflows Trader 7
1. Bid/Ask - This is the standard footprint chart that shows the volume traded on the bid and the volume traded on the offer. The most common form of order flow chart.
2. Delta - View the delta (difference between the volume traded on the bid versus the volume traded on the offer) horizontally. This view allows you to focus on the aggressive trading occurring in the market. The volume traded on the bid side versus the volume traded on the offer side at a price, NOT the two-way auction. This is delta at price.
3. Volume - A different way to view a chart. Shows the total volume at price at each level. The price level with the most volume in the bar is the POC.
4. Diagonal Delta - Plot the delta on your footprint chart based on the two-way auction, the bid versus the offer.
While the Bid/Ask chart is the most common order flow chart used. You have additional choices of viewing what market participants are doing in the market. Traders are finding edges through the order flow delta charts because they are able to pinpoint what the big aggressive institutional traders are doing in the market at any given moment.
Full Info
Attachments